We are seeing a significant decrease and price reduction in home listings on the MLS, especially in certain zip code areas
For example, in Dallas, we see a 38 percent drop in the number of homes listed on the market
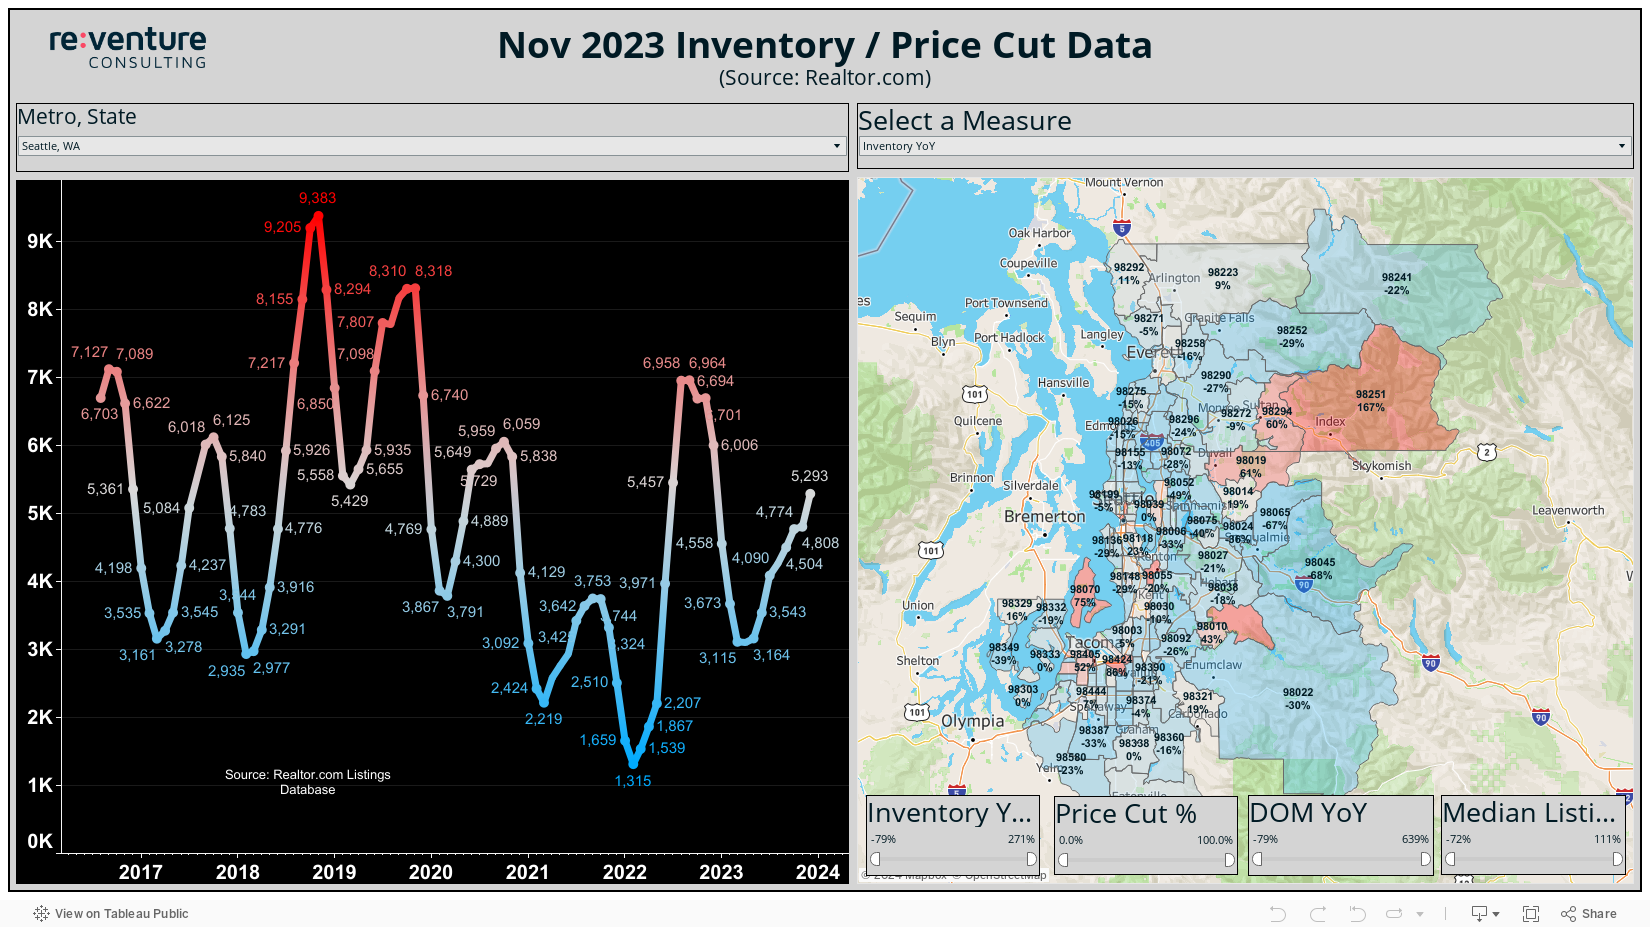
In this dynamic graph you can enter your zip code and check what percentage of houses advertised in your area have reduced prices
How to use the dynamic graph
An example scenario – let's choose Los Angeles:
1. At least 75% growth in inventory year over year
These are the places where inventory is growing really fast
2. Where sellers are cutting the price:
At least 30% price cut
These places are crushing first
Combination of high inventory growth and high price cuts
3. We only want to see where homes are sitting on the market
These are the zip codes to target to find better deals and cheaper prices
Dallas
If we will look at price cur percentage on the map instead of inventory, we can see that the share of price cut is more evenly distributed – around 30-to 50% of listings across most of teh zip codes across the Dallas metro
Lets isolate the areas that are really crashing in Dallas - so we can set the inventory growth to 150% which will be 1.5
Now we can see teh inventory where inventory increased the most in Dallas
Now let's set the price cut to 30%, which is 0.3
We see the areas in Dallas with large inventory increases and high price cuts
Now lets add days on teh market – we will do teh ones that increased at least 20% at days in the market – these zip codes are crashing the most
We can see Denton, prosper etc.
These places are going to have the most discounts
1. At least 75% growth in investment year over year
These are teh places where inventory is growing really fast
2. Where sellers are cutting the price:
At least 30% price cut
These places are crushing first
Combination of high investor growth and high price cuts
3. We only want to see where ehomes are sitting on the market
These are the zip codes to target to find better deals and cheaper prices
---
Dalls - a lot of zip codes have big increases in inventory
Most of teh zip codes have atl east 100% increase in inventory
The urban locations the inventory is actually down
Its important to understand whats going on in your market
The suburbs, Frisco, McKinney etc. has 120% increase in inventory, and in the urban areas its not comign as fast
If we will look at price cur percentage on the map instead of inventory, we can see that the share of price cut is more evenly distributed – around 30-to 50% of listings across most of teh zip codes across the dallas metro
Lets isolate teh areas that are really crashing in Dallas - so we can set the inventory growth to 150% which will be 1.5
Now we can see teh inventory where inventory increased the most in Dallas
Now let's set the price cut to 30%, which is 0.3
We see the areas in Dallas with large inventory increases and high price cuts
Now lets add days on teh market – we will do teh ones that increased at least 20% at days in the market – these zip codes are crashing the most
We can see Denton, prosper etc.
These places are going to have the most discounts
Frisco - 420% increase in inventory
The suburbs
If we look at price cut percentage the share of price cuts is more evenly distributed
Then the Growth/Share is the percentage of listings with a price cut
Let's find those areas that are crushing the most
1. Let's set the inventory increase in 150% - 1.5
2. Minimum price cut – 30%
3. days on teh market – at least 50% increase – thats too far, we cna do again in 20%
All of these areas we have a lot of inventory crushing the most – lots of inventory, properties sitting on the market, lots of price cuts
Prosper
https://www.youtube.com/channel/UCVTQunGrE3p7Oq8Owao5y_Q/join
1. Price cut share – the percentage of listings with a price cut:
Setting 30% means at least 30% of the listings have a price cut
It doesn't mean a price cut of 30% in the price
2. Inventory YoY – 75% means inventory increased by 75% from last year
Percentage of high inventory growth and high price cuts
3. Zip codes where homes are sitting on the market - 25% increase of days on the market
These are the places to find a better deal
Growth/Share – the actual increase in inventory from last year
Explanation:
https://www.youtube.com/watch?v=UFYiulbuu2c


