


Home prices are technically still climbing compared to last year but if you look a little closer, the momentum is definitely slowing down. This week, we got fresh data from both the FHFA and the S&P CoreLogic Case‑Shiller indices, and they’re telling a similar story: the housing market is cooling, especially when you strip out the seasonal fluff.
Let’s dig into what’s really happening beneath the surface.
The Basics: Two Reports, One Message

FHFA House Price Index (Seasonally Adjusted)
- Monthly (May): -0.2%
- April revised: From -0.4% to -0.3%
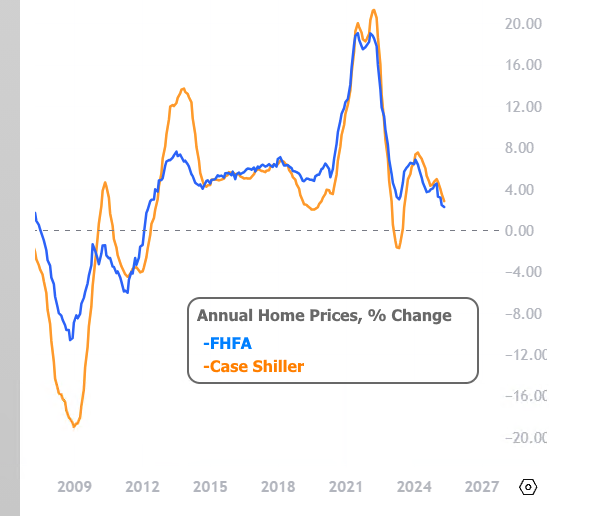
- Year-over-Year: +2.8%

Case‑Shiller National Index (Unadjusted)
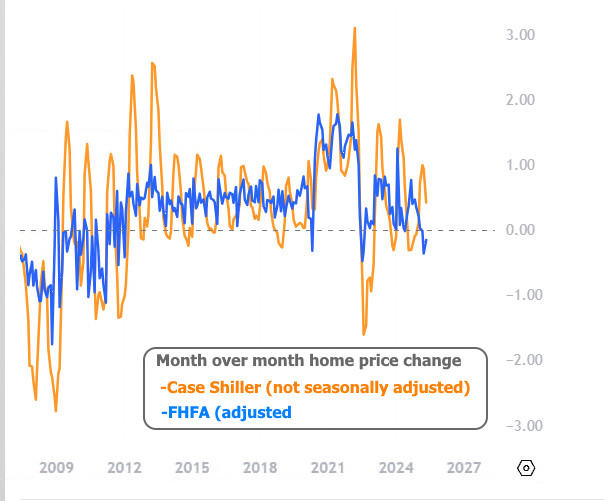
- Monthly (Raw): +0.4%
- Monthly (Seasonally Adjusted): -0.3%
- Year-over-Year: +2.3% (down from +2.7% in April)
While the raw numbers might make it seem like prices are still inching upward, the seasonally adjusted figures tell a different story. When you account for typical buying season trends, it’s clear that month-over-month price declines are taking hold.
Why Seasonal Adjustments Matter
It’s easy to misunderstand housing data at this time of year. Prices tend to rise in the spring and summer simply because that’s when most people buy and sell homes. That’s why economists use seasonally adjusted figures to reveal what’s really happening behind the normal ups and downs of the calendar.
And right now, what they reveal is softness.
Both the FHFA and Case‑Shiller indices posted their third straight month of seasonally adjusted declines. In the world of housing data, that’s a notable shift.
🗺️ Regional Breakdown: Some Winners, Some Losers
The FHFA data also gives us a regional snapshot. Here’s what stood out:
- Middle Atlantic (NY, NJ, PA) saw the biggest decline: -0.8% MoM
- West South Central (TX, OK, AR, LA) and New England managed slight gains: +0.3% MoM
- Despite recent softening, all nine census regions remain positive YoY, with gains ranging from +0.6% to +5.9%
So while the short-term trend is cooling, many markets are still well ahead of where they were a year ago.
🔍 Zooming Out: Slower Growth, Not a Crash
Yes, prices are softening. But let’s put it in perspective.
- FHFA’s +2.8% YoY gain is a step down, but still healthy by historical standards.
- Case‑Shiller’s +2.3% YoY growth is the smallest since July 2023, but it’s not negative.
In short: this is a slowdown, not a slide.
What’s Next? Rates and Inventory Will Play Key Roles
The good news is that this cooling comes at a time when other market factors may start working in buyers’ favor.
- Mortgage rates are showing signs of stabilization, which could improve affordability if the trend holds.
- Inventory is slowly picking up in some metros, which may help rebalance supply and demand without causing sharp price declines.
Bottom Line
Home prices are still higher than they were a year ago but the pace of growth is clearly slowing, and more metros are starting to show monthly price declines once adjusted for seasonality.
If you’re a buyer, this may be a sign that the market is shifting a bit more in your favor. For sellers, it’s a reminder to price realistically, as red-hot bidding wars are becoming less common in many areas.
The softening isn’t drastic but it’s persistent. And that’s something to keep an eye on as we head into late summer. For direct financing consultations or mortgage options for you visit 👉 Nadlan Capital Group.