


While there are signs that the U.S. housing market is gradually stabilizing, many Americans feel the market is effectively stuck. A new report from Realtor.com, Cruel Summer: Why the U.S. Housing Market is Stuck, shows that buyers, sellers, and builders each face unique challenges but all are united by a sense of frustration and uncertainty.
“The housing market is caught in a collective slowdown, touching everyone from buyers to sellers to builders,” said Jake Krimmel, Senior Economist at Realtor.com. “Even though each group is facing different pressures, the reaction is the same: hesitation and retreat. This has created a market that struggles to gain traction. Yet, a more balanced environment is slowly emerging, offering opportunities for those willing to be patient and flexible.”
Despite 21 consecutive months of rising inventory, home sales remain near multi-decade lows. Between May and July 2025 alone, inventory increased by roughly 28%, topping one million homes for three months in a row the highest level since November 2019. In many regions, prices have stabilized, but high mortgage rates and economic uncertainty continue to deter buyers and sellers alike. Realtor.com’s survey emphasizes that market activity is slowing less because of a crisis and more because all parties are collectively holding back.
Affordability Challenges Keep Buyers on the Sidelines
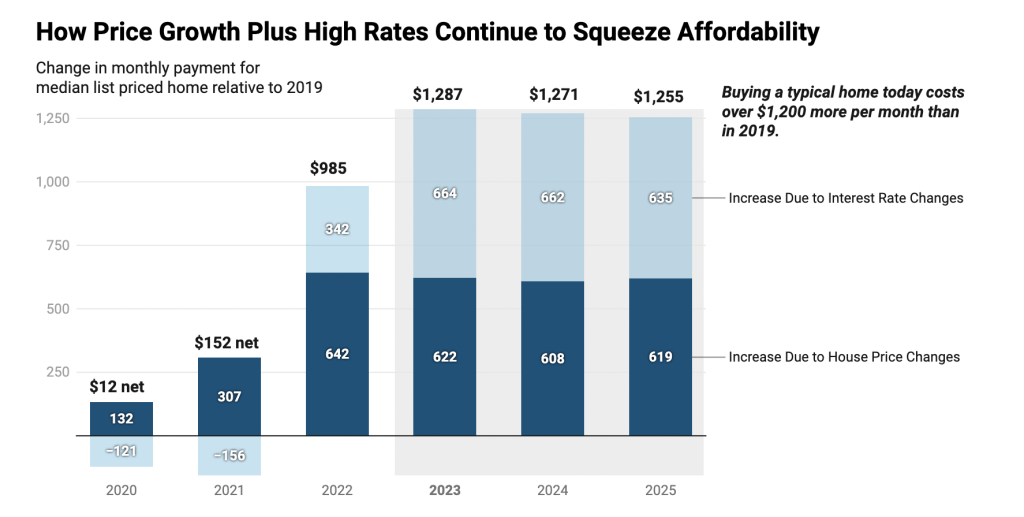
For prospective homeowners, affordability is still the biggest barrier. Mortgage rates remain elevated, driving up monthly payments even as home prices hover near $440,000 nationally, a level relatively unchanged since 2022. Compared with 2019, today’s buyers are paying over $1,200 more per month for a median-priced home due to rising interest rates and lingering price appreciation.
Income growth has not kept pace with the cost of homeownership, leaving many households priced out of the market. Realtor.com’s Buying Power Report shows that only 28% of active listings are within reach of a household earning the national median of $78,770 per year. Even in regions where prices have softened, high financing costs continue to limit buyers’ options.
Sellers, meanwhile, are facing their own challenges. Many remain reluctant to adjust their asking prices, opting instead to withdraw homes from the market. In June 2025, the delisting-to-new-listing ratio climbed to 0.21, meaning 21 listings were removed for every 100 new properties up from 0.13 in May. Some metro areas saw even more extreme results; for example, Miami recorded 59 delistings per 100 new listings. This reluctance to lower prices slows transactions, maintains elevated prices, and further constrains affordability.

Builders Feeling the Pinch
Homebuilders are also experiencing pressure. Despite modest month-to-month gains, permits and starts lag behind 2024 levels. In June 2025, building permits rose by just 0.2% month-over-month, though they were down 4.4% from June 2024. Housing starts increased 4.6% from May, yet remained slightly below the previous year (-0.5%).
Builders are cautious due to high financing costs, slower buyer demand, and rising material tariffs. Meanwhile, the U.S. still faces a shortage of roughly four million homes, highlighting the long-term importance of construction even as the current climate makes new projects harder to justify.
Regional Differences Compound the Problem
The market is not uniform across the country. In the South and West, slower sales and price reductions reflect an oversupply of homes, with the South accounting for over 50% of active listings in July 2025, outpacing its 39.4% share of U.S. households. Conversely, the Midwest and Northeast remain competitive, with strong demand and limited supply keeping prices elevated.
This regional fragmentation makes national trends more difficult to interpret and emphasizes the need for localized strategies from buyers, sellers, and policymakers alike.
The Impact on Buyers’ Budgets
Interest rates remain a central factor in affordability struggles. While rates were 3.5%–4.5% in 2019, they have largely stayed between 6.5% and 7% in 2025, significantly increasing monthly costs. For a $400,000 home with a 20% down payment, monthly payments would be roughly $1,500 at 4% interest versus $2,100 at 6.75%, a difference of $600 per month or $7,200 annually.
In major metro areas, this has dramatically eroded buying power:
| Metro | 2019 Max Target Home Price | Share of Homes < Target (2019) | 2025 Max Target Home Price | Share of Homes < Target (2025) | Difference in Max Price | Change in Buying Power (%) |
|---|---|---|---|---|---|---|
| Milwaukee-Waukesha, WI | $314,000 | 58.2% | $281,000 | 28.3% | -$33,000 | -10.5% |
| Houston-Pasadena-The Woodlands, TX | $330,000 | 59.2% | $299,000 | 32.4% | -$31,000 | -9.4% |
| Baltimore-Columbia-Towson, MD | $397,000 | 63.1% | $360,000 | 42.7% | -$37,000 | -9.3% |
| New York-Newark-Jersey City, NY-NJ | $397,000 | 28.2% | $360,000 | 13.1% | -$37,000 | -9.3% |
| Kansas City, MO-KS | $335,000 | 63.5% | $304,000 | 34.2% | -$31,000 | -9.3% |
Cities like Milwaukee, Houston, Baltimore, New York, and Kansas City have seen the steepest declines in purchasing power over the past six years, driven by modest wage growth and persistent interest rate pressure.
Homeownership Outlook
The decline in affordability is particularly affecting younger households, who are forced to consider smaller homes, longer commutes, or delaying their purchases altogether. With fewer homes priced within reach and monthly payments rising, potential buyers are stepping back, which in turn keeps homes on the market longer and incentivizes sellers to maintain high prices.
Despite these challenges, the housing market is not in crisis. Many homeowners retain significant equity, and those who locked in lower interest rates are insulated from recent rate increases. Over time, as rates begin to ease and expectations adjust, the market may gradually shift toward a more balanced, buyer- and seller-friendly environment. For direct financing consultations or mortgage options for you visit 👉 Nadlan Capital Group.
