US Home Price Trends 2025: FHFA Index Shows Annual Housing Price Growth of 1.8%

Home prices across the United States continued to rise in 2025, though at a slower pace than in previous years. According to the latest Federal Housing Finance Agency (FHFA) House Price Index, national home prices increased 1.8% between the fourth quarter of 2024 and the fourth quarter of 2025.
Quarterly data also shows a modest increase in housing prices. Between the third and fourth quarters of 2025, prices rose 0.8%, indicating steady but slower growth in the housing market.
On a monthly basis, the FHFA’s seasonally adjusted index recorded a 0.1% increase in December 2025 compared with November, suggesting that price gains have moderated toward the end of the year.
Key Data From the Latest FHFA House Price Index
The latest US home price index 2025 report provides several indicators of how the housing market performed at the end of last year.
Important figures include:
- Monthly price change (December 2025): +0.1%
- Quarterly price change (Q4 2025 vs. Q3 2025): +0.8%
- Annual price change (Q4 2025 vs. Q4 2024): +1.8%
- Purchase-Only Index record value: 440.4
The FHFA House Price Index measures changes in single-family home prices across the country based on mortgages purchased or guaranteed by Fannie Mae and Freddie Mac.
Because the index uses repeat sales data, it provides insight into how the value of the same homes changes over time.
Long-Term Housing Price Growth Continues
Despite slower price growth in 2025, the U.S. housing market has shown a long period of steady appreciation.
FHFA data shows that home prices have increased every year since 2012, marking more than a decade of consistent growth.
This long-term trend has been supported by several factors, including:
- Limited housing supply
- Population growth in many regions
- Low housing construction after the financial crisis
- Continued demand from homebuyers and investors
Even though mortgage rates increased in recent years, the housing market has remained relatively resilient.
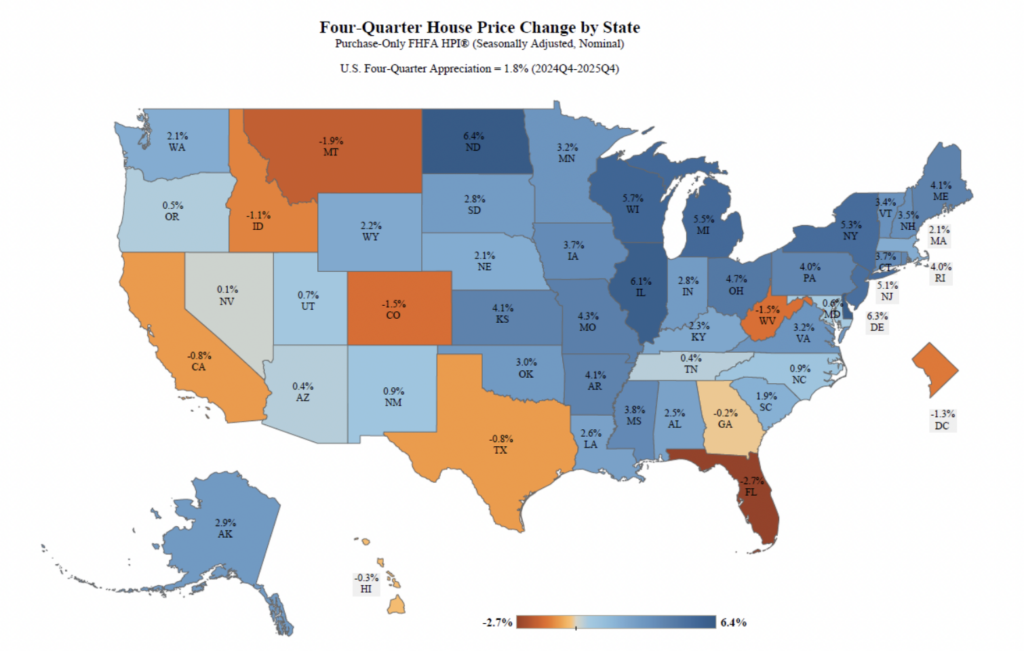
Home Prices Rose in Most States
The FHFA report shows that home prices increased across the majority of the United States in 2025.
Between the fourth quarter of 2024 and the fourth quarter of 2025, approximately 41 states recorded home price growth.
The states with the largest annual price increases were:
- North Dakota: +6.4%
- Delaware: +6.3%
- Illinois: +6.1%
- Wisconsin: +5.7%
- Michigan: +5.5%
These increases reflect regional demand patterns and local economic conditions.
States with strong job growth, limited housing supply, or increasing population often see stronger home price gains.
Some Areas Experienced Price Declines
While many states saw price increases, the FHFA report also identified several regions where home values declined.
Nine states and the District of Columbia recorded price drops during 2025.
Florida experienced the largest decline among states, with home prices falling 2.7% year over year.
These decreases may reflect regional housing supply changes, population shifts, or local market adjustments after several years of strong growth.
Housing markets often experience different cycles depending on local economic conditions.
Metro Area Price Trends
The FHFA report also examined housing price changes across the largest metropolitan areas.
Among the 100 largest metro areas in the United States, about 66 cities recorded price increases over the previous year.
The metro area with the strongest annual growth was:
- Allentown-Bethlehem-Easton, Pennsylvania–New Jersey: +8.9%
Meanwhile, the largest price decline among metro areas occurred in:
- Cape Coral-Fort Myers, Florida: –9.1%
These variations show how housing demand differs widely between regions depending on employment growth, migration patterns, and housing supply.
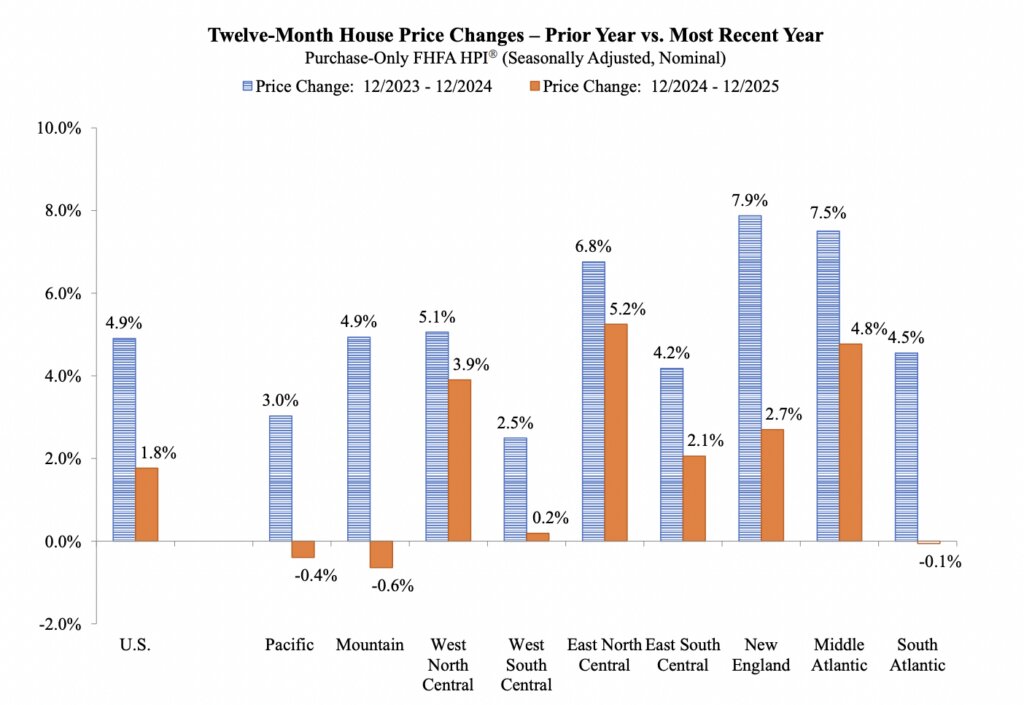
Regional Housing Market Differences
The FHFA divides the United States into nine census divisions to measure regional housing trends.
The report shows that six of the nine divisions recorded positive annual price growth in 2025.
The East North Central region experienced the largest annual increase, with prices rising 5.0%.
In contrast, the Mountain region recorded a slight decline of 0.2%, reflecting greater price volatility in that part of the country.
Housing markets in western states have experienced larger swings in recent years due to migration shifts and changes in affordability.
Housing Market Factors Influencing Prices
Several economic factors influence changes in home prices across the United States.
These include:
- Mortgage interest rates
- Housing supply levels
- Local employment conditions
- Population migration patterns
- Construction activity
Higher mortgage rates can reduce buyer demand by increasing monthly payments. However, limited housing inventory can still keep prices elevated if supply remains tight.
Because of this balance, housing prices often move gradually rather than rapidly.
Outlook for the US Housing Market
The US home price index 2025 data suggests the housing market is transitioning into a period of slower growth after several years of strong price increases.
Economists say price growth may continue to moderate if mortgage rates remain elevated and new housing supply increases.
However, strong demand for housing and long-term supply shortages could continue to support prices in many areas.
The FHFA will release additional housing price data in the coming months, including:
- Monthly HPI report through January 2026: March 31, 2026
- Quarterly report for Q1 2026: May 26, 2026
These upcoming reports will provide further insight into how the housing market is evolving as the economy enters the next phase of the housing cycle. For direct financing consultations or mortgage options for you visit 👉 Nadlan Capital Group.


Responses