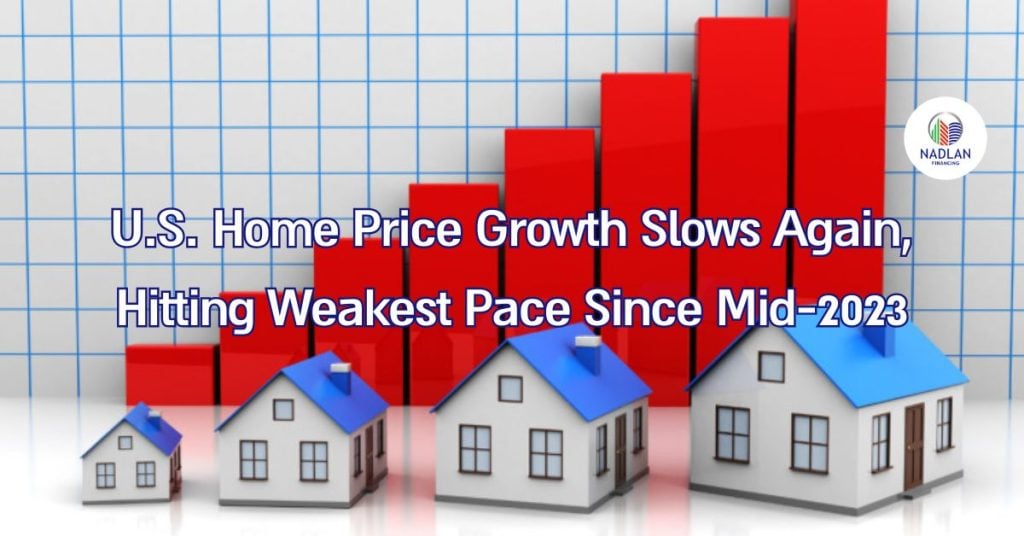
S&P Case-Shiller Index Reports Slowest Home Price Growth in Over Two Years

U.S. home price growth continued to lose steam in August, posting its weakest gains since mid-2023, according to the S&P Cotality Case-Shiller Home Price Index released Tuesday by S&P Dow Jones Indices.
“August’s data shows U.S. home prices continuing to slow, with the National Index up just 1.5% year-over-year,” said Nicholas Godec, CFA, CAIA, CIPM, Head of Fixed Income Tradables & Commodities at S&P Dow Jones Indices. “That’s the smallest annual increase in more than two years—and well below the current 3% inflation rate. For the fourth consecutive month, real home values have declined, meaning homeowners’ purchasing power is eroding despite nominal price gains.”
National and Regional Breakdown
The National Index rose 1.5% from a year earlier, after a 1.6% increase in July. The 10-City Composite advanced 2.1% annually, while the 20-City Composite rose 1.6%, both down from prior months as price momentum continued to fade.
Most of that appreciation came in the past six months, as prices were essentially flat in the preceding half-year.
Among the 20 metro areas tracked, New York once again led the nation, with a 6.1% annual gain. Chicago (5.9%) and Cleveland (4.7%) followed closely, as affordable Midwest and Northeast markets outperformed the rest of the country. On the opposite end, Tampa (-3.3%), Phoenix (-1.7%), and Miami (-1.7%) recorded the steepest declines. Western metros also softened, with San Francisco (-1.5%), Denver (-0.7%), San Diego (-0.7%), and Seattle (-0.1%) all posting slight year-over-year drops.
Month-to-Month Weakness
On a monthly basis, nearly all markets saw declines before seasonal adjustment. The National Index slipped 0.3%, while both the 10-City and 20-City Composites fell 0.6%. After seasonal adjustments, all three indexes remained slightly negative, highlighting a slowdown that extends beyond normal seasonal cooling.
“Nineteen of the 20 tracked metros saw price declines before seasonal adjustment, with only Chicago posting a monthly increase,” Godec noted. “Phoenix fell nearly 1% in a single month, while Los Angeles, Denver, and Portland all dropped between 0.7% and 1%.”
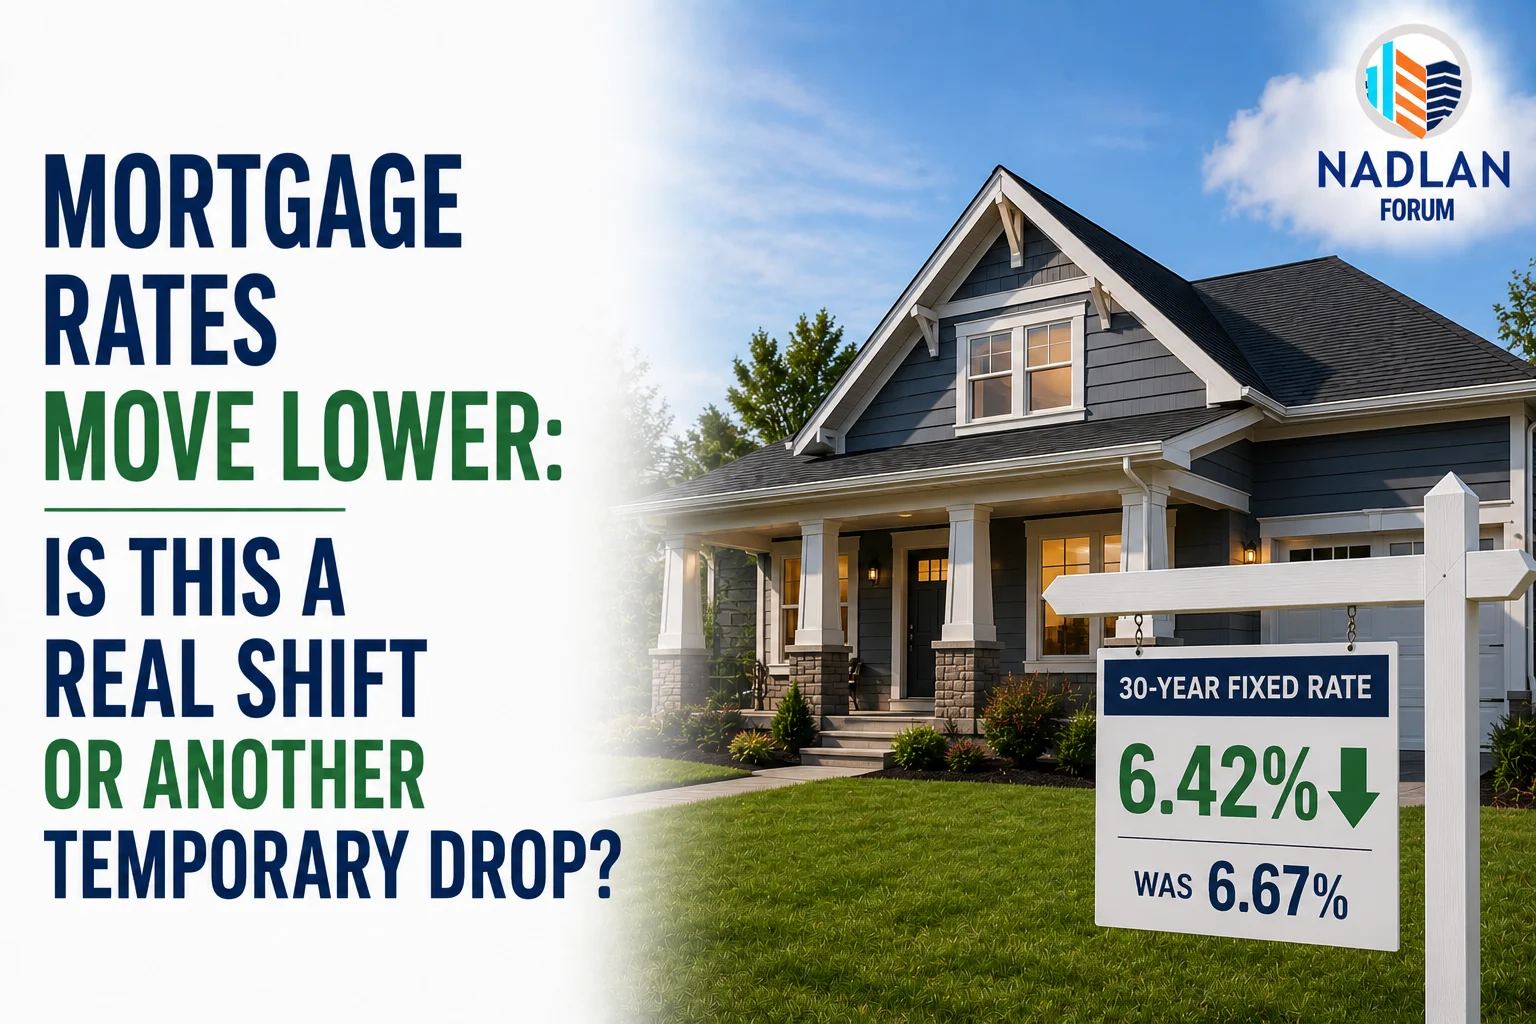
Mortgage rates averaging above 6.5% continued to weigh heavily on demand, even during the typically active summer buying season. “High financing costs combined with near-record home prices have pushed many would-be buyers out of the market,” Godec added.
Inflation and Housing: Real Values Slip
The August data reinforces a growing divide between home price appreciation and broader inflation trends. With inflation running at roughly twice the pace of home price growth, the real value of residential property has effectively declined for four straight months, marking the first such streak since before the pandemic.
“Homeowners may see nominal equity gains, but in real terms, their wealth is slipping,” said Godec. “We’re witnessing an adjustment toward a more balanced market, but the process will take time.”
Markets that experienced massive pandemic-era price surges such as Florida, Arizona, and parts of California are now seeing the sharpest pullbacks. Meanwhile, areas with steady job growth and constrained inventory, particularly in the Midwest and Northeast, are holding up better.
Expert Commentary and Buyer Impact
Lisa Sturtevant, Chief Economist at Bright MLS, said August’s numbers mark the seventh consecutive month of slower home price growth. “The U.S. National Index rose just 1.5% year-over-year—the weakest since July 2023,” she said. “As prices cool and mortgage rates dip slightly, affordability is improving, though only marginally.”
Using data from the National Association of REALTORS, Sturtevant illustrated the shift in affordability: “In June, when the median existing-home price was $432,700 and mortgage rates averaged 6.82%, the typical monthly payment was about $3,096 with a 10% down payment. By September, when the median price fell to $415,200 and rates averaged 6.2%, that payment dropped to roughly $2,824—a monthly savings of $271. For some buyers, that difference could make ownership attainable.”
Still, economic uncertainty and consumer caution persist. The Mortgage Bankers Association reports that while refinancing activity has spiked with falling rates, purchase applications remain weak. A Bright MLS survey of Mid-Atlantic agents found that more buyers are backing out of contracts, citing job worries and tighter budgets. Multiple-offer situations have become less common, and sellers are increasingly offering concessions to close deals.
Long-Term Context
Case-Shiller data shows that national home prices are up 78.8% from their 2006 peak, and more than 146% above the 2012 trough. However, the pace of appreciation has slowed sharply, signaling a more normalized environment after years of double-digit gains.
| Metric | 2006 Peak | 2012 Trough | Current | Change from Peak | Change from Trough |
|---|---|---|---|---|---|
| National | 184.61 | 133.99 | 330.02 | +78.8% | +146.3% |
| 20-City | 206.52 | 134.07 | 339.99 | +64.6% | +153.6% |
| 10-City | 226.29 | 146.45 | 359.59 | +58.9% | +145.5% |
What’s Next for Home Prices
Analysts say the housing market is gradually settling into a post-pandemic equilibrium, shaped by high mortgage costs, stubbornly limited inventory, and shifting regional dynamics.
“Some of the highest-cost areas like New York and Boston are still seeing steady gains thanks to strong local economies and tight supply,” Sturtevant said. “In contrast, markets reliant on remote work migration or investor demand are softening faster as those tailwinds fade.”
Heading into the final quarter of 2025, economists are watching local employment data and company hiring trends to forecast which regions might stabilize or continue cooling. The consensus: slower price growth is here to stay, at least until borrowing costs come down significantly or new housing supply meaningfully expands.
For now, the era of rapid, double-digit home appreciation is over, replaced by a fragile balance between affordability pressures and economic uncertainty. As Godec summarized, “This transition may ultimately set the stage for a healthier market—but it’s clear the housing boom of the past few years has reached its limit.” For direct financing consultations or mortgage options for you visit 👉 Nadlan Capital Group.


Responses