U.S. Housing Supply Grows Again, But Market Shows Signs of Slowing

Home shoppers had more options on the market in October, as housing supply rose for the second full year in a row. Active listings increased 15.3% compared to the same time last year, according to new data from Realtor.com. This marks another month of steady improvement, but the pace of growth is clearly cooling. Even with inventory topping one million homes for the sixth month in a row, supply is still more than 13% below pre-pandemic levels seen from 2017–2019.
Inventory Growth Is Slowing Across Key Regions
All four major U.S. regions saw more homes for sale than last year:
- West: +17%
- South: +17%
- Midwest: +12%
- Northeast: +9%
The South and West previously the fastest-growing regions are now seeing slower improvements compared to the spring. Meanwhile, the Midwest and Northeast are gradually closing the gap, narrowing the sharp differences that defined much of 2024.
Every one of the 50 largest metro areas posted year-over-year increases. The biggest jumps were:
- Washington, DC (+38%)
- Charlotte (+36%)
- Las Vegas (+35%)
These cities saw some of the strongest gains as more homeowners listed their properties and buyers pulled back.
Buyer Demand Remains Soft as Homes Sit Longer
Even with more choices on the market, buyers are not rushing in. Homes spent 63 days on average before going under contract five days longer than a year ago. That marks 19 straight months of slower sales.
Other key trends include:
- Pending home sales fell 1.9% year-over-year
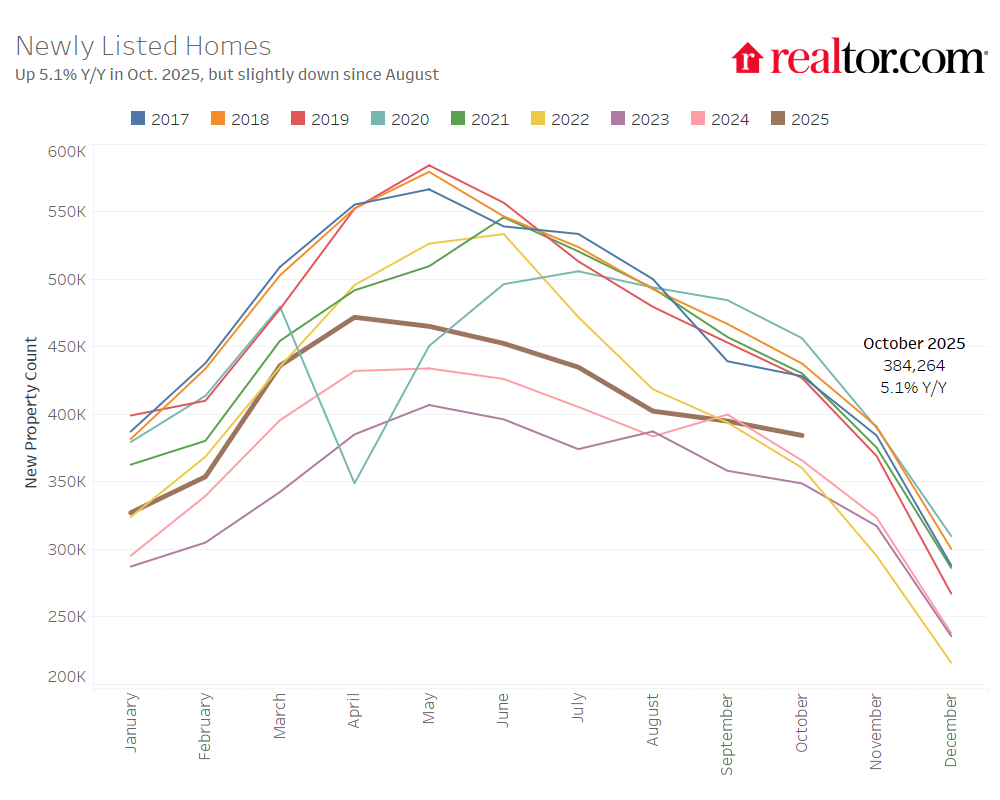
- New listings rose slightly from last year but declined month-over-month due to normal seasonal patterns
In short, sellers are listing more homes, but buyers are approaching the market carefully.
Home Prices Hold Steady With Regional Differences
Nationally, prices barely moved. The average U.S. list price reached $424,200, up just 0.4% from last October. But regionally, the picture varied:
- South: Prices fell 0.9%
- West: Prices fell 2.6%
- Northeast: Mostly flat
- Midwest: Small increase
Price-per-square-foot trends also reflect this divide. While the Northeast saw a 3.8% rise, most other regions saw mild declines.
Price cuts remain common. About 20% of listings reduced their asking price, especially in markets like Denver, Portland, and Indianapolis. On the flip side, metros such as Hartford and Chicago still sit far below their pre-pandemic inventory norms, showing how uneven the recovery remains.
Federal Government Shutdown Slows Activity in Key Metros
This month’s special analysis highlights the shutdown’s impact. Cities with large numbers of federal workers such as Washington, DC, Virginia Beach, Oklahoma City, and Baltimore are seeing a dip in both new listings and buyer searches. Uncertainty about paychecks and job stability is making people hesitate before entering the housing market.
Market Entering a More Balanced but Slower Phase
Taken together, the data shows that the market is shifting from a fast-moving correction to a slower, more cautious pattern. Inventory is still rising but not as quickly. Prices are leveling out. Buyers remain hesitant even with mortgage rates easing off their recent highs.
This combination suggests the housing market may be approaching a plateau, where progress continues but at a slower, steadier pace rather than the rapid changes seen earlier in the post-pandemic period. For direct financing consultations or mortgage options for you visit 👉 Nadlan Capital Group.


Responses