FHFA Report Shows Uneven Home Price Growth Across U.S. Regions
U.S. home prices continued to rise in November, but the latest data shows that gains were far from even across the country. Some regions posted solid growth, while others saw prices stall or dip, highlighting how local market conditions continue to shape housing trends.
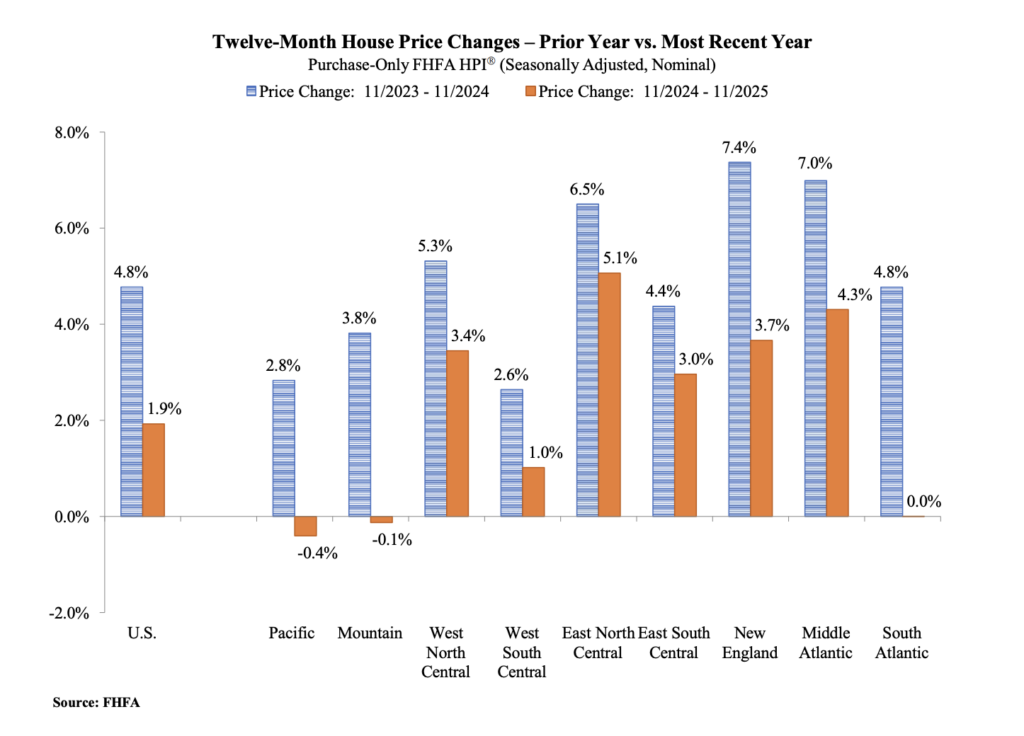
According to the seasonally adjusted Federal Housing Finance Agency House Price Index (FHFA HPI), national home prices increased 0.6% in November. Compared with November 2024, prices were 1.9% higher year over year. The previously reported 0.4% increase in October was unchanged after revision.
Regional Differences Remain Clear
Price movements varied widely across the nine U.S. census divisions. On a monthly basis, seasonally adjusted changes ranged from flat growth (0%) in the Middle Atlantic region to a 1.1% increase in the East South Central division.
Looking at the past 12 months, regional performance was even more mixed. Annual price changes ranged from a 0.4% decline in the Pacific division to a 5.1% gain in the East North Central division, showing how some markets are still seeing firm demand while others are cooling.
These differences reflect variations in housing supply, migration patterns, local job markets, and affordability pressures.
What the FHFA House Price Index Measures
The FHFA HPI tracks changes in single-family home values using a large set of repeat-sale transactions. It compares the price of the same property over time, which helps isolate true price changes and avoid distortions caused by differences in home size or quality.
The index includes data from all 50 states and more than 400 metro areas, with records going back to the mid-1970s. FHFA publishes price data at multiple levels, including national, census division, state, metro area, county, ZIP code, and census tract.
Different Index Types Offer Deeper Insight
FHFA produces several versions of its house price index to reflect different segments of the market:
- Purchase-Only HPI: Tracks prices of conforming, conventional home purchases and is the most commonly cited index.
- All-Transactions HPI: Adds appraisal data from refinance loans to purchase data.
- Expanded-Data HPI: Includes county recorder data and FHA-backed mortgages; used to adjust conforming loan limits for Fannie Mae and Freddie Mac.
- Distress-Free HPI: Excludes foreclosures and short sales to focus on traditional transactions.
- Annual HPI: Uses all-transactions data to provide yearly price trends for small geographic areas.
- Manufactured Housing HPI: Tracks prices for single-family detached manufactured homes financed with conventional mortgages.
Each version uses the same core methodology but serves different analytical purposes.
What the Data Signals Going Forward
November’s figures suggest that home prices are still moving higher overall, but without strong momentum. Growth is uneven, and regional differences are becoming more important as higher borrowing costs and affordability limits shape buyer behavior.
The next FHFA House Price Index report is scheduled for February 24, 2026, and will include monthly data through December as well as quarterly results for the fourth quarter of 2025. That update should offer a clearer view of how home prices ended the year and whether recent trends are holding. For direct financing consultations or mortgage options for you visit 👉 Nadlan Capital Group.


Responses