Home Prices Cool in Over 100 Major Cities as National Growth Stays Flat

U.S. home prices are still edging higher at the national level, but the pace has slowed sharply and more local markets are seeing prices move down. New data shows a clear split between regions where prices remain supported and others where buyers are gaining more leverage.
According to an analysis of the Zillow Home Value Index by ResiClub, national home values were up just 0.1% year over year from December 2024 to December 2025. That marks a major slowdown from the 2.6% annual growth rate recorded one year earlier.
While national price growth has recently stabilized, December’s reading was only slightly higher than the cycle low of -0.01% seen in August 2025.
More Than One-Third of Major Markets See Declines
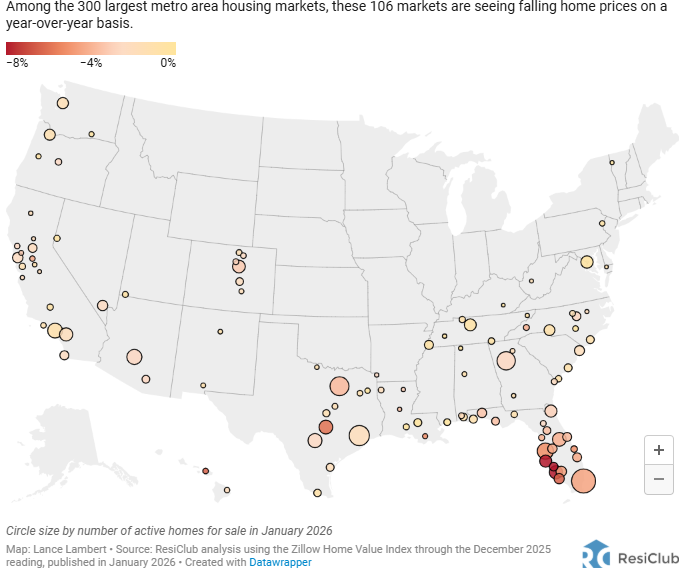
The ResiClub analysis found that 106 of the nation’s 300 largest housing markets, or about 35%, recorded year-over-year price declines in December. Notably, none of the declining markets were located in the Midwest.
The share of markets with falling prices rose steadily through the first half of 2025 as inventory levels increased and buyer leverage improved. Since mid-year, however, that trend has largely leveled off.
Here’s how the number of declining markets changed over time:
- January 2025: 31 markets (10%)
- March 2025: 60 markets (20%)
- June 2025: 110 markets (36%)
- December 2025: 106 markets (35%)
The data suggests that the housing market moved quickly toward buyers earlier in 2025, but that shift has since slowed as inventory growth cooled.
Inventory Levels Driving Local Price Moves
Home prices are still rising modestly in regions where inventory remains well below pre-pandemic 2019 levels. This is especially true in parts of the Northeast and Midwest, where supply remains tight and price support is stronger.
By contrast, markets where inventory now exceeds pre-pandemic levels are seeing more softness. Areas in Texas, Florida, and Colorado are experiencing flat prices or small pullbacks as buyers gain more options.
ResiClub noted that many of the weakest markets are concentrated in the Sunbelt, particularly along the Gulf Coast and in the Mountain West. These regions saw some of the fastest price growth during the pandemic, often well ahead of local income growth.
Sunbelt Faces Added Pressure
As pandemic-driven migration slowed and mortgage rates rose starting in 2022, markets like Tampa and Austin became more dependent on local incomes to support elevated prices. That adjustment has been challenging in some areas.
According to Fast Company, the softening has been amplified by a surge in new home construction across much of the Sunbelt. Builders in these regions have been more willing to cut prices or offer incentives to keep sales moving.
Those incentives have pulled some buyers away from existing homes and toward new construction, adding more resale inventory and putting additional pressure on prices in the resale market.
Big Picture: A Split Housing Market
Even with 106 major metro areas seeing year-over-year price declines, the majority of large markets are still posting gains. 194 of the 300 largest housing markets continue to show rising prices, even if growth is modest.
Overall, the data points to a housing market that is cooling and becoming more balanced, rather than one entering a broad downturn. National prices are holding steady, but local conditions matter more than ever, with inventory levels and past price surges playing a key role in where prices go next. For direct financing consultations or mortgage options for you visit 👉 Nadlan Capital Group.


Responses