Renters Favor Local Markets: Newcomers Dominate Other U.S. Cities
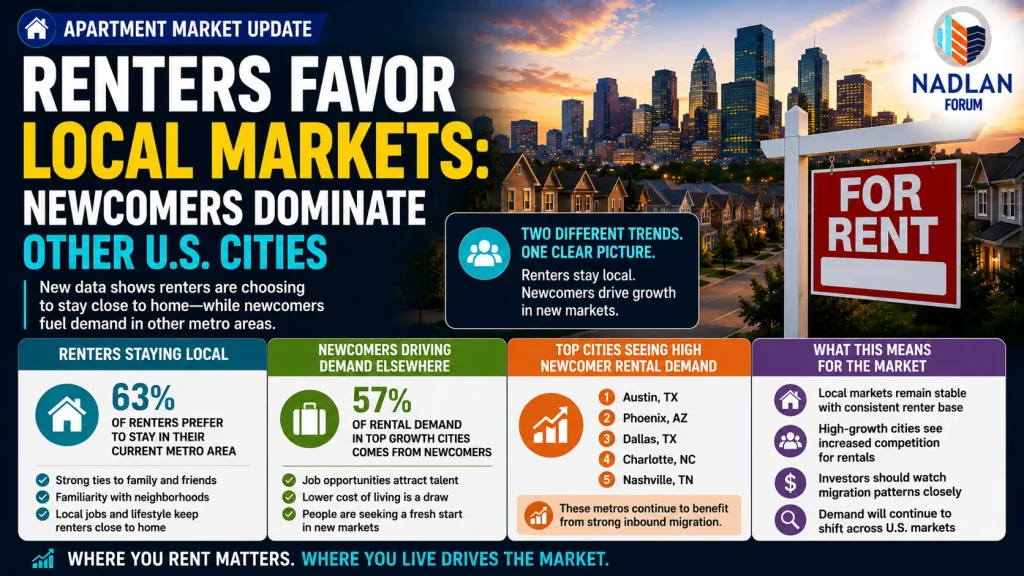
Renters across the United States are showing distinct patterns of movement, revealing which rental markets are retaining residents and which are being reshaped by new arrivals. According to the Realtor.com May Rental Report, the national median asking rent decreased to $1,686, marking a 1.5% year-over-year decline and the 34th consecutive month of falling rents.
While rents continue to soften on a national level, local market dynamics vary significantly, with some metros maintaining strong resident loyalty while others attract a high percentage of newcomers.
Key Findings in Rental Trends
- Median rent for 0–2 bedroom apartments fell year-over-year in all 50 major metros.
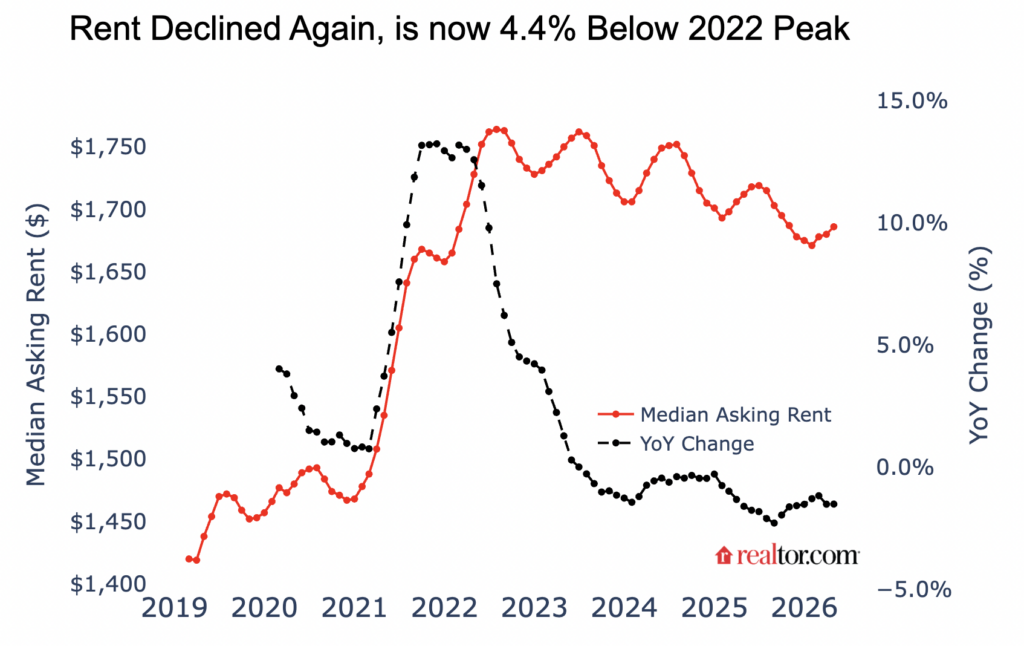
- National median asking rent: $1,686, down $26 (-1.5%) YoY.
- Compared to pre-pandemic levels, rent is $248 (+17.2%) higher, but $78 (-4.4%) lower than the summer 2022 peak.
- Studio: $1,422, down $27 (-1.9% YoY)
- One-bedroom: $1,573, down $24 (-1.5% YoY)
- Two-bedroom: $1,885, down $28 (-1.5% YoY)
Danielle Hale, Chief Economist at Realtor.com, notes that markets like Las Vegas retain local renters due to softening rents and high local value, while cities like Raleigh attract newcomers drawn by jobs and relative affordability.
Local Renter Loyalty Leads in Some Markets
Certain metros have high retention of residents searching for rentals within their local area:
| Market | Local Market Traffic Q1 2026 | Out-of-Metro Traffic Q1 2026 | Local Market Q1 2020 | Out-of-Metro Q1 2020 |
|---|---|---|---|---|
| Las Vegas-Henderson-North Las Vegas, NV | 70.0% | 30.0% | 75.3% | 24.7% |
| Austin-Round Rock-San Marcos, TX | 66.7% | 33.3% | 64.4% | 35.7% |
| San Antonio-New Braunfels, TX | 65.1% | 34.9% | 69.6% | 30.4% |
| Houston-Pasadena-The Woodlands, TX | 64.6% | 35.4% | 53.3% | 46.8% |
| San Diego-Chula Vista-Carlsbad, CA | 64.3% | 35.7% | 62.0% | 38.0% |
Houston, in particular, has seen an 11-point increase in local loyalty since 2020. Baltimore, Cincinnati, and Kansas City show similar patterns of increasing resident retention.
Cities Dominated by Newcomers
Other markets are experiencing significant inbound demand from out-of-metro renters:
| Market | Out-of-Market Q1 2026 | Local Residents Q1 2026 | Out-of-Market Q1 2020 | Local Residents Q1 2020 |
| Raleigh-Cary, NC | 69.1% | 30.9% | 59.0% | 41.0% |
| Hartford-West Hartford-East Hartford, CT | 68.6% | 31.4% | 48.6% | 51.4% |
| Providence-Warwick, RI-MA | 65.7% | 34.3% | 52.8% | 47.2% |
| Richmond, VA | 64.7% | 35.3% | 52.5% | 47.5% |
| Baltimore-Columbia-Towson, MD | 64.4% | 35.6% | 48.6% | 51.4% |
Raleigh saw the largest share of out-of-market interest, with 69.1% of rental views from outside the metro, mainly from renters in New York, Boston, and Washington, D.C., attracted by lower rents and strong job markets.
Detroit’s rental market also changed dramatically: out-of-market demand increased from 28.1% in 2020 to 51.8% in 2026 Q1.
San Francisco: A Unique Case
San Francisco bucks national trends. While out-of-market demand increased from 43.1% to 64.1%, local loyalty also rose from 44.0% to 55.0%.
Factors include:
- A rise in homeownership, from 49% to 51.7% in one year
- Growth in AI and tech employment, enabling renters to purchase homes
- Remaining renters showing more settled behavior
According to Jiayi Xu, Economist at Realtor.com, “The post-pandemic reshuffling has largely run its course in San Francisco. Renters remaining in the market are more focused on staying put.”
Summary
Rental trends in the U.S. vary widely by metro area.
- Local loyalty is strongest in Las Vegas, Austin, San Antonio, Houston, and San Diego.
- Newcomers dominate in Raleigh, Hartford, Providence, Richmond, and Baltimore.
- San Francisco demonstrates both rising homeownership and increased local rental loyalty.
Understanding these patterns can help renters, landlords, and investors make informed decisions about pricing, marketing, and investment opportunities in the evolving rental market. For direct financing consultations or mortgage options for you visit 👉 Nadlan Capital Group.
Note: Data includes apartments, condos, townhomes, and single-family rental units.


Responses