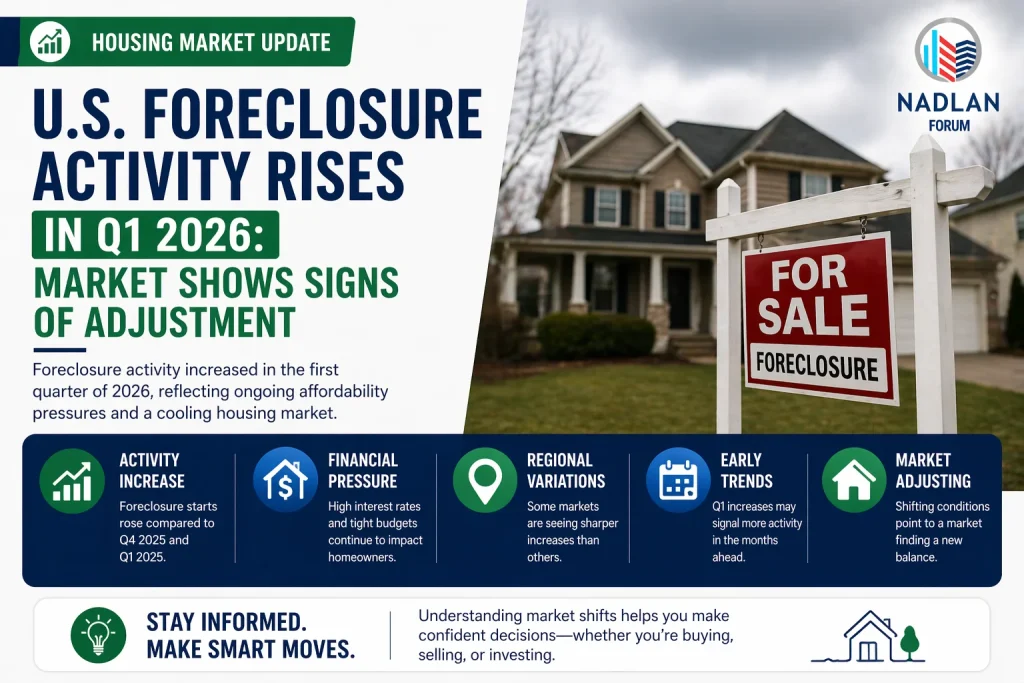
U.S. Foreclosure Activity Maintains Gradual Upward Trend in Q3 2025

The third quarter of 2025 saw foreclosure activity in the U.S. continue its slow but steady rise, according to the latest Q3 2025 U.S. Foreclosure Market Report from ATTOM. Estimates indicate that 101,513 homes received foreclosure filings, marking a less than 1% increase from the previous quarter and a 17% rise compared with the same period a year ago.
In September alone, there were 35,602 foreclosure filings, representing a slight 0.3% drop from August, but a notable 20% increase from September 2024.
Expert Insight
“In 2025, foreclosure activity has consistently trended upward, with both foreclosure starts and completions posting year-over-year gains for consecutive quarters,” said Rob Barber, CEO of ATTOM. “While overall levels remain within historical norms, the persistence of these trends could signal emerging financial strain among certain borrower segments, particularly in high-cost or economically sensitive areas.”
Key Foreclosure Statistics
- Nationwide filings: In September 2025, one in every 3,997 U.S. properties received a foreclosure notice.
- Highest state rates: South Carolina (1 in 2,883), Delaware (1 in 2,325), Nevada (1 in 2,417), Indiana (1 in 2,697), and Florida (1 in 2,182).
- Foreclosure starts: 23,761 properties began the process in September, a 20% increase year-over-year and a 2% decrease from August.
- Completed foreclosures: 3,780 properties were foreclosed upon in September, a 44% increase from a year ago, though down 7% from the previous month.

Quarterly Overview
For Q3 2025, 72,317 properties began the foreclosure process nationwide up 2% from Q2 and 16% from Q3 2024. States with the highest foreclosure starts included:
- Texas: 9,736
- Florida: 8,909
- California: 7,862
- Illinois: 3,515
- New York: 3,234
Metropolitan areas with the most starts among populations of 200,000 or more were:
- Houston: 3,763
- New York: 3,452
- Chicago: 3,144
- Miami: 2,502
- Los Angeles: 2,321
Areas with Highest Foreclosure Rates
When examining rates per housing unit, the top states were:
- Florida: 1 in 814
- Nevada: 1 in 831
- South Carolina: 1 in 867
- Illinois: 1 in 944
- Delaware: 1 in 974
Among large metro areas, the worst-affected included:
- Lakeland, FL: 1 in 470
- Columbia, SC: 1 in 506
- Cape Coral, FL: 1 in 589
- Cleveland, OH: 1 in 593
- Ocala, FL: 1 in 665
Other major cities with one million-plus populations in the top 20 worst foreclosure rates were Jacksonville, Las Vegas, Houston, and Orlando.
Real Estate Owned (REO) Properties
Foreclosures resulting in lender repossessions (REOs) increased to 11,723 in Q3 2025, up 4% from the prior quarter and 33% from a year ago. States with the highest REO counts were:
- Texas: 1,288
- California: 1,132
- Florida: 762
- Pennsylvania: 708
- New York: 644
Foreclosure Timelines
The average foreclosure process lasted 608 days, continuing a declining trend since mid-2020:
- Longest timelines: Louisiana (3,632 days), Nevada (2,667), Rhode Island (1,929), New York (1,867), Hawaii (1,710).
- Shortest timelines: West Virginia (135), Texas (154), Virginia (160), Wyoming (165), Montana (174).
Takeaways
Although some states saw minor quarterly decreases, the overall trajectory indicates a steady year-over-year increase in foreclosure activity, with both starts and completions rising consecutively. While foreclosure levels remain historically moderate, the persistence of growth over successive quarters highlights potential localized financial stress, particularly in markets experiencing high housing costs, slower wage growth, or economic vulnerability.
Analysts suggest closely monitoring these trends, as continued economic pressures could gradually impact both housing supply and lender strategies, shaping the broader real estate market into 2026.For direct financing consultations or mortgage options for you visit 👉 Nadlan Capital Group.


Responses