
These Are the Most House-Poor Cities in America — And Why It’s Getting Harder to Keep Up

Many people know someone who is “house-poor” a homeowner who spends so much of their income on the mortgage and other housing bills that very little is left for anything else. A new study from Consumer Affairs uses fresh 2024 U.S. Census data to find out exactly where this issue is hitting the hardest.
The report uses the same 28% affordability rule that mortgage lenders rely on. According to that rule, no more than 28% of your monthly income should go toward housing costs and no more than 36% toward all debt combined. The study ranked major U.S. cities to see where homeowners are stretching far beyond that benchmark.
Key National Takeaways
- Hialeah, Florida, ranks as the most house-poor city in the country, with homeowners spending 36.9% of their income on housing.
- Florida is the most house-poor state overall, with four cities in the top 10.
- In the top 20 cost-burdened cities, most homeowners spend well above the 28% affordability limit.
- The least house-poor city is Chandler, Arizona, where housing costs make up just 18.4% of income.
The Most House-Poor Cities in America
Most of the top 10 are located in three major regions:
Florida, Southern California, and New York all places known for high living costs and steep home prices.
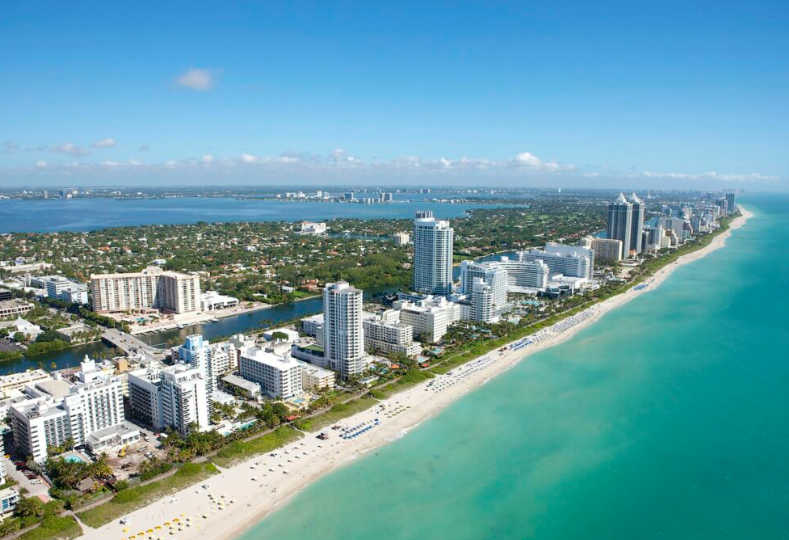
Top 10 Most House-Poor Cities:
- Hialeah, FL – 36.9%
- New York, NY – 33%
- New Orleans, LA – 32.6%
- Los Angeles, CA – 32.5%
- Miami, FL – 32.3%
- Pembroke Pines, FL – 32%
- St. Petersburg, FL – 30.6%
- Honolulu, HI – 30.5%
- Yonkers, NY – 30.2%
- Chula Vista, CA – 29.5%
1. Hialeah, FL: The Most House-Poor City in the U.S.
- Annual homeowner income: $71,386
- Monthly income: $5,949
- Median monthly housing cost: $2,193
Hialeah leads the nation with the highest cost burden. While housing costs are only slightly above the U.S. average, incomes trail far behind. Local wages are 34% below the national median, and the gap is widening.
From 2020 to 2024:
- Housing costs rose 45%
- Income rose 35%
This mismatch pushed homeowners 7.4% deeper into house-poor territory in just four years.
2. New York, NY
- Annual homeowner income: $121,443
- Monthly income: $10,120
- Median housing cost: $3,335
New Yorkers face some of the highest housing expenses in the country nearly 50% above the national average. Even with above-average incomes, many are struggling. Roughly 1 in 5 households are now “severely cost-burdened,” meaning they spend more than 50% of their income on housing.
Home prices in New York rose 9% year-over-year, adding pressure to already tight budgets.
3. New Orleans, LA
- Annual homeowner income: $85,843
- Median housing cost: $2,332
New Orleans stands out because its home values are below the national average, yet homeowners still spend more than 32% of their income on housing.
Why?
Insurance costs, storm risks, high utility bills, and rising rates tied to climate instability are pushing monthly bills higher.
Since 2020, New Orleans became 6.1% more house-poor, though a recent rise in incomes helped slightly ease the burden last year.
4. Los Angeles, CA
- Annual homeowner income: $130,265
- Monthly housing cost: $3,523
Los Angeles has the highest housing costs of any city in the top 10. Even though property tax rates are low at 0.69%, the city’s high home values drive expenses up.
The median home is valued at $947,900, meaning the average homeowner paid nearly $7,000 in property taxes, far above the national median.
5. Miami, FL
- Annual homeowner income: $107,481
- Housing cost: $2,893
Miami homeowners spend nearly a third of their income on housing, despite earning only slightly more than the national median.
Because local job growth is concentrated in low-wage industries, many households simply don’t earn enough to support the nearly $3,000 monthly mortgage payments typical in the city.
To comfortably buy a home in Miami today, a family would need to make $176,438 a year, far above what most households earn.
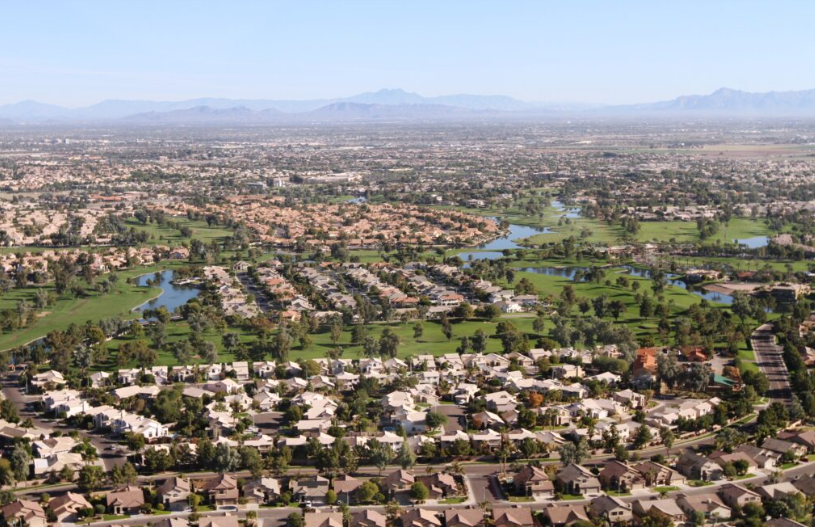
Where Homeowners Are Least Likely to Be House-Poor
The cities with the lowest housing burdens tend to have:
- Strong job markets
- Moderate home prices
- Steady income growth
Top 10 Least House-Poor Cities:
- Chandler, AZ
- Cary, NC
- Huntsville, AL
- Durham, NC
- Toledo, OH
- Gilbert, AZ
- Madison, WI
- Grand Rapids, MI
- Salt Lake City, UT
- Charlotte, NC
Chandler tops the list with housing costs taking up just 18.4% of income. Cary and Durham benefit from strong tech and research industries, while Gilbert has one of the highest Gen Z and Millennial homeownership rates in the nation.
How Housing Costs Have Shifted Nationwide
Between 2020 and 2024:
- National incomes rose 24%
- Housing costs rose 26%
This means homeowners nationwide are about 1% more cost-burdened than they were five years ago but some cities saw increases of 40% to 50%, making the situation far more difficult in certain regions.
How to Avoid Becoming House-Poor
Whether you’re a new buyer or a longtime homeowner, these steps can help keep your budget stable:
✔ Stick to the 28% Rule
Just because a lender approves a bigger mortgage doesn’t mean it’s wise. Stay below the recommended spending level on housing.
✔ Know the Hidden Costs
Insurance, taxes, HOA fees, and repairs can add hundreds per month.
✔ Keep an Emergency Cushion
Life happens. Extra savings can prevent late payments.
✔ Compare Lenders
Even a small interest rate difference can save thousands per year.
✔ Don’t Let Emotions Take Over
It’s easy to overspend for a “dream home.” Focus on long-term affordability.
Bottom Line
The latest data shows a clear divide across the U.S. Some cities offer room to breathe financially, while others leave homeowners stretched thin. With housing costs rising faster than incomes in many regions, buyers need to plan carefully, stick to a budget, and choose a location where their money goes further. For direct financing consultations or mortgage options for you visit 👉 Nadlan Capital Group.


























Responses