דף הבית מכירות נחשול בפלורידה כמו שוקי קליפורניה ראה דו ספרתית שנתי ירידות במארס…
דף הבית מכירות נחשול בפלורידה כמו שוקי קליפורניה ראה דו ספרתית שנתי ירידות במארס
מכירות ומחירי הבתים ירדו משנה לשנה בסן פרנסיסקו,
סן חוזה ואורנג ‘קאונטי כמו פעילות הדיור זינק במטרו
עם מחירי הבתים הנמוכים יותר ואת נטל המס
מחירי הבתים בארה”ב לא השתנו כמעט במארס,
מתקתק למטה ב 0.1 אחוז לפני שנה, לחציון של
$ 295,100 על פני מטרו רצועות Redfin. למרות זאת בקושי
נרשם כירידה, זה המחיר הראשון בשנה
ירידה על שיא מאז פברואר 2012, כאשר חציון הביתה
מחיר המכירה תחתית החוצה ב $ 171,600.
רק תשעה מתוך 85 אזורי המטרו הגדולים ביותר רפיף רצועות ראו א
ירידה שנתית של חציון מחיר, כולל 13
אחוז ירידה בסן חוזה א
1 אחוז לטבול בסן
פרנסיסקו. במקביל, אלה ויקרים אחרים יקר
שווקי החוף, כולל לוס אנג’לס,
תפוז
קאונטי וסיאטל
ירידה דו-ספרתית במספר השנים לעומת מספר הדירות שנמכרו
בזמן
Home Sales Surge in Florida as California Markets See Double-Digit Annual Declines in March
Home sales and prices fell year over year in San Francisco,
San Jose and Orange County as housing activity surged in metros
with lower home prices and tax burdens
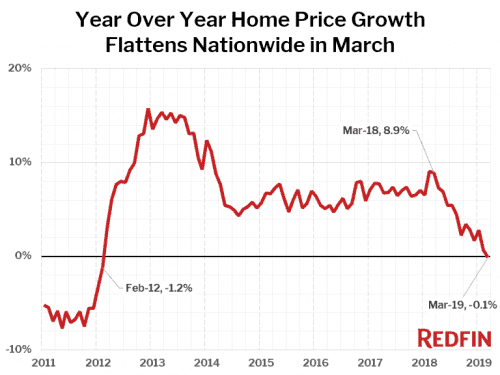
U.S. home-sale prices were essentially unchanged in March,
ticking down by 0.1 percent from a year ago, to a median of
$295,100 across the metros Redfin tracks. Although this barely
registers as a decline, it’s the first year-over-year price
decrease on record since February of 2012, when the median home
sale price bottomed out at $171,600.
Only nine of the 85 largest metro areas Redfin tracks saw a
year-over-year decline in their median price, including a 13
percent drop in San Jose and a
1 percent dip in San
Francisco . At the same time, these and other expensive West
Coast markets, including Los Angeles ,
Orange
County , and Seattle posted
double-digit year-over-year declines in the number of homes sold
while several large affordable markets on the East Coast saw big
annual sales gains. As housing market activity shifted from more to
less expensive places, the median price (which is the midpoint of
all sales) shifted to reflect the homes that sold last month.
”Homebuyers have backed off in West Coast metros where home
prices have risen far out of their budgets,” said Redfin chief
economist Daryl Fairweather . “The opposite is happening in
more affordable metros where buyers are eager to buy now to take
advantage of low mortgage rates. In California, where the tax
burden is high, some people are finding they have to
move out of state to afford to buy a home. As a result, home
sales are down in metros throughout the state.”
Much like the national home price chart, the headline number
that sales increased 2 percent masks a lot of variation among metro
areas. The number of homes sold actually fell in 37 of the 85
largest metro areas that Redfin tracks. Meanwhile, 24 metro areas
saw double-digit increases in home sales compared to a year
earlier.
What’s important is where home sales fell versus where home
sales increased. Compare the median prices of the 10 metro areas
that experienced the biggest increases in home sales compared to
last year with the 10 that saw the biggest decreases in sales:
Biggest Gains in Home Sales
Biggest Declines in Home Sales
Rank
Metro Area
Year-Over-Year Sales
Median Price
Metro Area
Year-Over-Year Sales
Median Price
1
Camden,
NJ
56.2%
$180,000
Salt Lake
City, UT
-21.0%
$320,000
2
Baltimore,
MD
34.5%
$255,000
Los
Angeles, CA
-19.4%
$620,000
3
Allentown,
PA
24.9%
$184,700
Las
Vegas, NV
-18.8%
$280,000
4
Orlando,
FL
23.5%
$249,900
Orange County,
CA
-16.4%
$700,000
5
Newark,
NJ
22.7%
$328,900
Fresno,
CA
-16.0%
$275,000
6
Memphis,
TN
20.2%
$165,000
Oxnard,
CA
-15.6%
$600,000
7
Tampa,
FL
19.3%
$225,000
Seattle,
WA
-15.0%
$560,000
8
Warren,
MI
18.7%
$205,000
Riverside,
CA
-14.3%
$370,000
9
New
York, NY
18.2%
$383,625
San
Jose, CA
-14.3%
$1,115,000
10
Pittsburgh,
PA
16.7%
$162,000
San Francisco,
CA
-13.7%
$1,400,000
Average
$233,913
Average
$624,000
On average, the metro areas that saw the biggest declines in
home sales were more than 2.5 times as expensive as the metro areas
where sales surged. The cheapest of the 10 metro areas where sales
declined (Fresno, $275,000) was still more expensive than eight of
the top 10 metros where sales surged.
“Salt Lake City and Las Vegas experienced rapid home price
growth in 2017 and 2018,” explained Fairweather. “Even though
these metros are still affordable to Californians, home sales are
likely down because it has become harder for locals to afford to
buy homes.”
Market Summary
March 2019
Month-Over-Month
Year-Over-Year
Median sale price
$295,100
2.6%
-0.1%
Homes sold
259,100
39.1%
2.0%
New listings
353,400
27.9%
-2.8%
All Homes for sale
800,400
3.2%
3.6%
Median days on market
49
-10
1
Months of supply
3.1
-1.1
0.1
Sold above list
20.0%
1.6%
-4.5%
Median Off-Market Redfin Estimate
$299,000
0.3%
6.2%
Average Sale-to-list
97.9%
0.3%
-0.6%
The number of homes for sale at the end of the month was up 3.6
percent from a year earlier in March. The number of homes newly
listed for sale fell 2.8 percent from March 2018.
Of the 85 largest metro areas Redfin tracks, 46 saw an increase
in the number of homes for sale compared to a year earlier, with
the largest gains coming yet again in San Jose (+104.3%) and
Seattle (+82.9%). The metro areas with the biggest declines in
homes for sale were Albuquerque
(-36.4%) and New Orleans
(-34.4%).
Home-selling speeds were largely unchanged from a year earlier
nationally, increasing just one day to a median of 49 days on
market. Again though, there was significant variation among metro
areas, with 14 metro areas speeding up by 10 days or more from a
year earlier and 15 metro areas slowing down by 10 days or
more.
Many of the markets slowing down the most were clustered on the
West Coast, such as Orange
County (+18 days), San Diego
(+16 days), Los Angeles, (+15 days), Portland,
OR egon (+14 days), San Jose (+13 days) and Seattle (+12 days).
On the flip side, the markets speeding up the most were mostly
inexpensive metro areas on the East Coast or in the South or
Midwest, such as New Orleans (-64 days), Knoxville,
Tennessee (-48 days), Philadelphia
(-29 days), Pittsburgh (-19 days), Atlanta (-16
days) and Indianapolis
(-13 days).
In March, 20.0 percent of homes sold above the list price, down
from 24.5 percent in March 2018. Meanwhile 22.5 percent of homes on
the market in March had a price drop, up from March 2018’s share
of 20.2 percent.
Other March Highlights
Competition
Denver was the fastest market, with half of all homes pending
sale in just 15 days, up from 7 days a year earlier. Oakland, CA
and San Francisco were the next fastest markets with 16 and 19
median days on market, followed by Washington, DC (19) and Seattle
(19).
The most competitive market in March was San Francisco where
60.5% of homes sold above list price, followed by 52.3% in Oakland,
CA, 49.5% in San Jose, CA, 40.0% in Tacoma, WA, and 35.4% in
Minneapolis.
Prices
Camden, NJ had the nation’s highest price growth, rising
12.7% since last year to $180,000. Milwaukee had the second highest
growth at 12.6% year-over-year price growth, followed by Dayton, OH
(12.1%), Detroit (11.5%), and Long Island, NY (11.2%).
9 metros saw price declines in March. San Jose, CA declined the
most since last year falling 12.9 percent to $1,115,000.
Sales
Camden, NJ led the nation in year-over-year sales growth, up
56.2%, followed by Baltimore, up 34.5%. Allentown, PA rounded out
the top three with sales up 24.9% from a year ago.
Salt Lake City saw the largest decline in sales since last
year, falling 21.0%. Home sales in Los Angeles and Las Vegas
declined by 19.4% and 18.8%, respectively.
Inventory
San Jose, CA had the highest increase in the number of homes
for sale, up 104% year over year, followed by Seattle (83%) and
Salt Lake City (53%).
Albuquerque, NM had the largest decrease in overall inventory,
falling 36.4% since last March. New Orleans (-34%), Rochester, NY
(-27%), and Montgomery County, PA (-22%) also saw far fewer homes
available on the market than a year ago.
Redfin Estimate
The median list price-to-Redfin Estimate ratio was 95.4% in San
Francisco, the lowest of any market. Only 10.9% of homes in San
Francisco were listed for more than their Redfin Estimate.
Conversely, the median list price-to-Redfin Estimate ratio was
102.3% in Miami and 102.1% in West Palm Beach, FL, which means
sellers are listing their homes for more than the estimated value
in those metro areas. In Miami, 82.0% of homes were listed above
their Redfin Estimate, the highest percentage of any metro.
Below are market-by-market breakdowns for prices, inventory, new
listings and sales for markets with populations of 750 thousand or
more. For downloadable data on all of the markets Redfin tracks,
visit the Redfin
Data Center .
Median Sale Price
Redfin Metro
Median Sale Price
Month-Over-Month
Year-Over-Year
Albany, NY
$200,000
1.0%
2.4%
Allentown, PA
$184,700
-0.6%
-2.8%
Atlanta, GA
$242,100
5.3%
5.3%
Austin, TX
$305,000
3.4%
1.7%
Bakersfield, CA
$235,000
1.8%
5.1%
Baltimore, MD
$255,000
2.0%
-0.8%
Baton Rouge, LA
$198,500
0.8%
1.8%
Birmingham, AL
$205,000
10.8%
6.4%
Boston, MA
$472,000
4.8%
2.2%
Bridgeport, CT
$363,300
10.4%
-0.5%
Buffalo, NY
$146,000
0.7%
5.8%
Camden, NJ
$180,000
6.5%
12.7%
Charlotte, NC
$245,700
4.6%
3.7%
Chicago, IL
$240,000
4.3%
0.4%
Cincinnati, OH
$177,000
4.1%
5.4%
Cleveland, OH
$145,000
6.0%
7.4%
Columbus, OH
$200,800
2.9%
8.5%
Dallas, TX
$295,000
3.5%
0.0%
Dayton, OH
$129,900
6.5%
12.1%
Denver, CO
$408,600
2.2%
1.4%
Detroit, MI
$128,200
8.2%
11.5%
El Paso, TX
$158,000
-3.1%
3.2%
Fort Lauderdale, FL
$265,000
2.3%
6.0%
Fort Worth, TX
$245,000
4.3%
5.4%
Fresno, CA
$275,000
5.8%
5.8%
Grand Rapids, MI
$196,100
1.7%
4.6%
Greenville, SC
$206,900
3.5%
3.5%
Hampton Roads, VA
$220,000
0.0%
-2.2%
Hartford, CT
$205,000
6.0%
-2.3%
Honolulu, HI
$585,000
7.3%
4.8%
Houston, TX
$240,000
3.4%
2.6%
Indianapolis, IN
$180,500
6.2%
4.2%
Jacksonville, FL
$229,900
4.7%
2.2%
Kansas City, MO
$215,000
7.5%
4.8%
Knoxville, TN
$195,000
3.9%
2.6%
Las Vegas, NV
$280,000
1.8%
5.7%
Long Island, NY
$450,000
5.9%
11.2%
Los Angeles, CA
$620,000
2.9%
3.3%
Louisville, KY
$179,900
-4.1%
3.1%
McAllen, TX
$153,800
2.5%
9.0%
Memphis, TN
$165,000
0.6%
-0.9%
Miami, FL
$300,000
3.4%
1.7%
Milwaukee, WI
$210,000
12.9%
12.6%
Minneapolis, MN
$275,000
5.8%
7.4%
Montgomery County, PA
$305,000
10.7%
5.5%
Nashville, TN
$288,000
2.9%
2.9%
New Haven, CT
$199,900
2.3%
8.1%
New Orleans, LA
$210,000
2.4%
5.0%
New York, NY
$383,600
1.6%
3.7%
Newark, NJ
$328,900
1.2%
6.1%
Oakland, CA
$735,000
5.0%
2.1%
Oklahoma City, OK
$178,000
1.7%
7.9%
Omaha, NE
$202,000
5.5%
10.4%
Orange County, CA
$700,000
3.1%
-1.4%
Orlando, FL
$249,900
0.0%
6.3%
Oxnard, CA
$600,000
4.5%
3.5%
Philadelphia, PA
$200,000
11.1%
6.7%
Phoenix, AZ
$270,000
1.0%
5.3%
Pittsburgh, PA
$162,000
7.3%
1.2%
Portland, OR
$392,000
0.5%
1.8%
Providence, RI
$267,500
4.9%
4.9%
Raleigh, NC
$285,000
-0.5%
1.8%
Richmond, VA
$250,000
9.2%
4.7%
Riverside, CA
$370,000
1.1%
4.2%
Rochester, NY
$137,500
6.0%
5.9%
Sacramento, CA
$395,000
1.9%
1.3%
Salt Lake City, UT
$320,000
0.3%
2.6%
San Antonio, TX
$223,800
2.9%
4.1%
San Diego, CA
$565,000
0.9%
0.9%
San Francisco, CA
$1,400,000
9.4%
-1.2%
San Jose, CA
$1,115,000
6.2%
-12.9%
Seattle, WA
$560,000
2.7%
0.0%
St. Louis, MO
$176,000
7.0%
5.1%
Tacoma, WA
$365,000
1.7%
4.3%
Tampa, FL
$225,000
0.0%
2.7%
Tucson, AZ
$219,000
1.5%
6.8%
Tulsa, OK
$165,000
5.1%
3.1%
Warren, MI
$205,000
9.7%
5.1%
Washington, DC
$390,000
2.6%
0.0%
West Palm Beach, FL
$272,500
0.2%
0.0%
Worcester, MA
$250,000
3.1%
4.2%
National
$295,100
2.6%
-0.1%
Homes Sold
Redfin Metro
Homes Sold
Month-Over-Month
Year-Over-Year
Albany, NY
687
26.1%
-3.5%
Allentown, PA
854
48.3%
24.9%
Atlanta, GA
9,582
39.3%
0.0%
Austin, TX
2,803
22.1%
-5.5%
Bakersfield, CA
698
35.3%
-8.4%
Baltimore, MD
4,161
71.8%
34.5%
Baton Rouge, LA
913
33.1%
2.5%
Birmingham, AL
1,526
44.9%
6.9%
Boston, MA
3,164
31.6%
0.2%
Bridgeport, CT
805
33.5%
5.1%
Buffalo, NY
702
13.2%
-3.7%
Camden, NJ
2,129
51.7%
56.2%
Charlotte, NC
3,480
37.6%
0.2%
Chicago, IL
8,013
44.6%
-2.7%
Cincinnati, OH
2,009
34.2%
-1.3%
Cleveland, OH
2,115
33.5%
-8.4%
Columbus, OH
2,590
66.8%
10.9%
Dallas, TX
5,351
31.2%
-5.5%
Dayton, OH
1,027
62.0%
13.2%
Denver, CO
4,805
50.8%
10.7%
Detroit, MI
1,704
11.4%
10.1%
El Paso, TX
691
29.9%
3.9%
Fort Lauderdale, FL
3,286
66.4%
1.2%
Fort Worth, TX
2,913
28.7%
0.4%
Fresno, CA
695
42.7%
-16.0%
Grand Rapids, MI
1,231
39.6%
8.2%
Greenville, SC
1,192
42.1%
15.7%
Hampton Roads, VA
2,253
45.4%
11.2%
Hartford, CT
1,037
40.5%
7.2%
Honolulu, HI
748
43.8%
-6.1%
Houston, TX
7,181
32.1%
-0.2%
Indianapolis, IN
2,575
35.5%
-5.4%
Jacksonville, FL
2,630
46.1%
14.0%
Kansas City, MO
2,460
31.9%
-12.9%
Knoxville, TN
1,173
40.6%
6.8%
Las Vegas, NV
3,243
29.4%
-18.8%
Long Island, NY
2,349
1.2%
-5.7%
Los Angeles, CA
5,170
36.8%
-19.4%
Louisville, KY
1,362
51.2%
9.4%
McAllen, TX
246
3.8%
-8.6%
Memphis, TN
1,228
45.0%
20.2%
Miami, FL
3,087
63.3%
14.5%
Milwaukee, WI
1,536
47.6%
5.9%
Minneapolis, MN
4,415
47.7%
15.6%
Montgomery County, PA
2,011
46.7%
14.7%
Nashville, TN
3,377
45.4%
10.8%
New Haven, CT
733
33.8%
7.5%
New Orleans, LA
1,214
27.7%
14.5%
New York, NY
7,317
30.8%
18.2%
Newark, NJ
2,297
34.1%
22.7%
Oakland, CA
2,002
41.5%
-12.8%
Oklahoma City, OK
1,986
56.7%
14.1%
Omaha, NE
881
12.4%
-6.1%
Orange County, CA
2,187
42.8%
-16.4%
Orlando, FL
4,607
55.1%
23.5%
Oxnard, CA
608
24.1%
-15.6%
Philadelphia, PA
1,918
41.8%
6.5%
Phoenix, AZ
8,093
30.4%
-13.7%
Pittsburgh, PA
2,143
61.6%
16.7%
Portland, OR
2,820
22.7%
-9.3%
Providence, RI
1,415
31.0%
-1.9%
Raleigh, NC
2,278
33.1%
6.7%
Richmond, VA
1,618
53.8%
4.1%
Riverside, CA
4,378
32.1%
-14.3%
Rochester,..——————————————————————
Mon, 22 Apr 2019 22:39:30 +0000
חדשות נדלן מארצות הברית – פוסט מתורגם אוטומטית 2 – גרסא עברית
לפרסום שאלות בנושא נדל”ן בארצות הברית הצטרפו עכשיו לקבוצת נדל”ן ולעניין – פורום נדל”ן ארצות הברית:
www.facebook.com/groups/ForumNadlanUSA
——————————————————————
Home sales and prices fell year over year in San Francisco, San Jose and Orange County as housing activity surged in metros with lower home prices and tax burdens U.S. home-sale prices were essentially unchanged in March, ticking down by 0.1 percent from a year ago, to a median of $295,100 across th…
את התגובות המקוריות לפוסט ניתן לקרוא בתחתית דף הפוסט הנוכחי באתר או בקישור לפוסט בפייסבוק וכמובן שאתם מוזמנים להצטרף לדיון


Responses